Charts and Graphs
My son has been learning to play Civilization. I’ve loved these games since I was a kid when the first one came out far, far to long ago. Unfortunately for a 7yo, they have grown quite a bit more complex over the years. He loved the exploration and meeting new civs but he was having trouble grasping everything else there was to do in the game.
So I tried to explain some of it to him but its a lot to take in. We narrowed down to focus just on how to build a good city, what you’re looking for. etc. In the game, you have districts that do certain things. Campuses generate science so your civilization can learn new technologies. Industrial districts produce Production which you use to build everything. Etc etc.
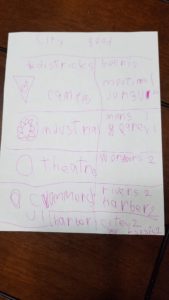
All on his own, he decided that he needed to make a chart. He went and got some paper and started writing things down. I can’t tell you how proud I felt at that moment. He’s using problem solving, he’s organizing information, he like charts. I love charts. It’s so nerdy.